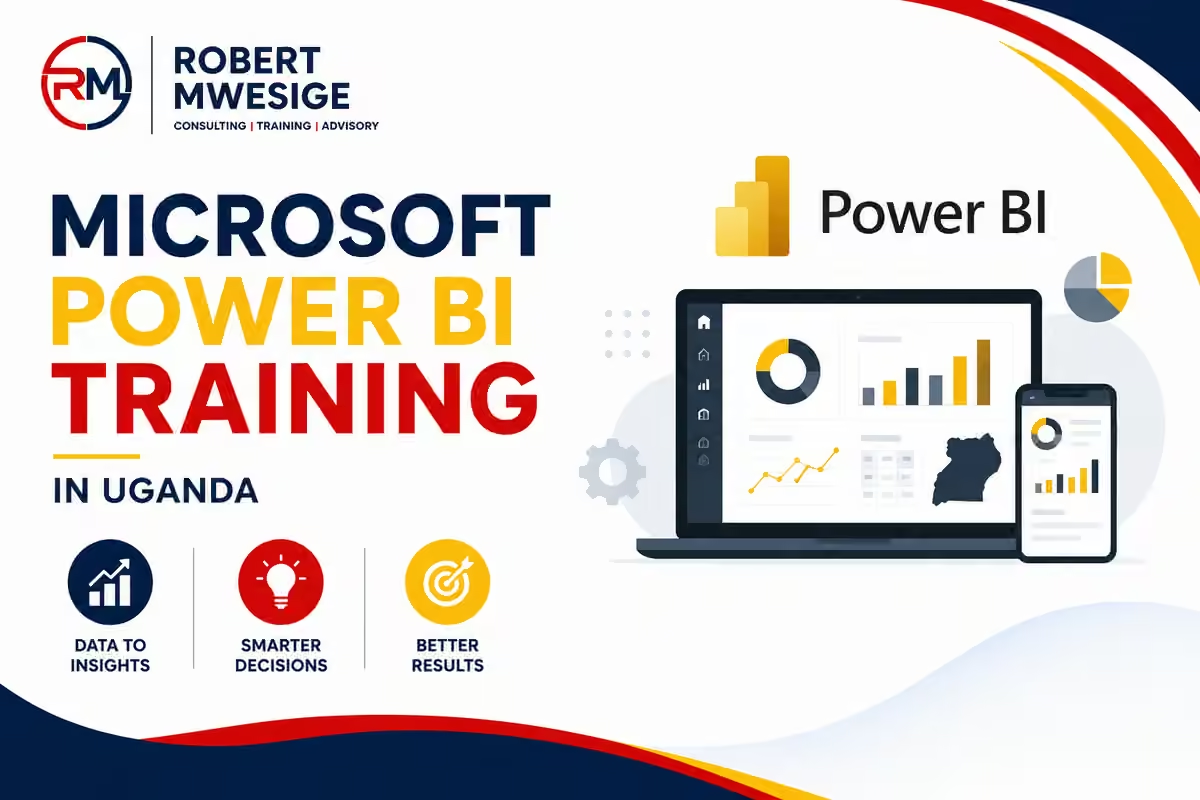
Microsoft Power BI Training Course in Uganda: Data Analysis, Dashboards, DAX & Business Intelligence
A practical hands-on Power BI course for professionals who want to turn Excel files, databases and business data into reliable models, interactive reports and decision-ready insights. Participants learn the complete workflow from connecting and cleaning data to modeling, DAX calculations, visualization, publishing, collaboration and security.
What Is Microsoft Power BI?
Microsoft Power BI is a business analytics platform for connecting to data, preparing and modeling it, creating interactive reports and sharing insights with other people. Power BI Desktop is the principal authoring application for building data models and reports, while the Power BI service provides cloud-based publishing, collaboration and consumption capabilities. Power BI is also a core workload within Microsoft Fabric, Microsoft's broader analytics platform.
Power BI is often introduced as a visualization tool, but that description is too narrow for professional use. A reliable report depends on several layers working together: the source data must be understood, transformations must be repeatable, relationships must reflect the business, calculations must be correct, visuals must communicate the right message and access must be governed appropriately. The course therefore treats Power BI as an end-to-end analytical workflow rather than a collection of colourful charts.
Power BI Desktop can connect to many kinds of data sources, including Excel workbooks, text files, databases, cloud services and web-based sources. Power Query is used to shape and transform data. The model layer defines relationships and calculations, including measures written with Data Analysis Expressions (DAX). Reports then present that model through interactive visuals, filters, drill-through and other analytical experiences. When content is published, the Power BI service can support collaboration through workspaces, apps, permissions, scheduled refresh and security features.
Bring data from relevant sources into a repeatable transformation process instead of manually cleaning every report cycle.
Build relationships and reusable measures so the same business logic drives many visuals consistently.
Turn the model into interactive reports and distribute appropriate insights to users through controlled access.
Why Power BI Skills Matter for Organisations in Uganda
Many Ugandan organisations already hold useful operational data in Excel workbooks, accounting systems, HR systems, CRM platforms, survey exports, databases and cloud applications. The challenge is often not the absence of data but the difficulty of combining it, checking its quality and presenting it in a form that managers can use quickly. Manual monthly reporting can consume significant staff time because the same cleaning, copying, reconciliation and charting activities are repeated whenever new data arrives.
Power BI can help teams move from isolated files toward reusable analytical models and standard reporting processes. An organisation can, for example, connect sales transactions with product and branch information, combine budget and actual expenditure, consolidate project monitoring data, analyze service performance by district or department, or monitor HR indicators. The benefit is not automatic: a poorly designed model can still produce misleading dashboards. That is why practical training needs to develop data literacy and modeling judgement alongside software skills.
The same tool can support very different sectors. A bank may analyze branch performance and customer trends; an NGO may monitor programme outputs and donor indicators; a retailer may track sales, inventory and margins; a government agency may analyze service-delivery or operational data; a university may track enrolment and performance; and a manufacturing company may monitor production, downtime and cost. The course therefore uses transferable analytical principles rather than tying Power BI to a single profession.
Power BI does not repair poor data automatically
Dashboards are only as reliable as the data, model and business definitions behind them. Training should help participants identify quality problems, validate assumptions and create transparent measures rather than merely produce attractive visuals.
Who Should Attend Microsoft Power BI Training?
This programme is suitable for professionals who work with operational, financial, programme, customer or management data and need to produce repeatable analysis and reports. Participants do not need to be software developers, but they should be comfortable working with business data, tables and basic spreadsheet concepts.
Business & Data Analysts
Professionals responsible for transforming raw data into management reports, dashboards, trends, KPIs and decision support.
Finance & Accounting Teams
Staff analyzing budgets, actuals, revenue, expenditure, profitability, variance and management reporting across periods or units.
M&E, Research & Programme Teams
Professionals working with survey, project, indicator, beneficiary, field and performance data across locations and reporting cycles.
Managers & Decision Makers
Leaders who want to understand how dashboards are built, interpret business metrics and specify better analytical requirements.
Excel Power Users
Employees who already use spreadsheets extensively and want a more scalable approach to data preparation, modeling and interactive reporting.
IT & Reporting Professionals
Teams supporting reporting infrastructure, data access, publication, refresh, permissions, governance and business-user adoption.
Participants whose main need is advanced data engineering, complex Fabric architecture or enterprise administration may require a more specialised programme. This course focuses on the professional data-analyst workflow and can be adapted upward or downward depending on the group's baseline experience.
Microsoft Power BI Training Fees & Upcoming Kampala Batches
Monthly three-day in-person cohorts at Eureka Place Hotel & Suites in Ntinda, Kampala. Select your preferred intake and register directly through the short WhatsApp booking form or email enquiry form.
A practical professional training setting in Ntinda for hands-on Power BI work, guided exercises and participant discussion.
| Action | Batch / Dates & Seat Status | Delivery Mode & Location | Investment Fee |
|---|---|---|---|
2026 BatchRegistration Open November 23 – 25, 2026 Monday to Wednesday | In-Person · Eureka Place Hotel & SuitesPlot 16 Vubyabirenge Road, Ntinda, Kampala | US$399per participant | |
2026 BatchRegistration Open December 28 – 30, 2026 Monday to Wednesday | In-Person · Eureka Place Hotel & SuitesPlot 16 Vubyabirenge Road, Ntinda, Kampala | US$399per participant | |
2027 Jan BatchRegistration Open January 25 – 27, 2027 Monday to Wednesday | In-Person · Eureka Place Hotel & SuitesPlot 16 Vubyabirenge Road, Ntinda, Kampala | US$399per participant | |
2027 Feb BatchRegistration Open February 22 – 24, 2027 Monday to Wednesday | In-Person · Eureka Place Hotel & SuitesPlot 16 Vubyabirenge Road, Ntinda, Kampala | US$399per participant | |
2027 Mar BatchRegistration Open March 22 – 24, 2027 Monday to Wednesday | In-Person · Eureka Place Hotel & SuitesPlot 16 Vubyabirenge Road, Ntinda, Kampala | US$399per participant | |
2027 Apr BatchRegistration Open April 26 – 28, 2027 Monday to Wednesday | In-Person · Eureka Place Hotel & SuitesPlot 16 Vubyabirenge Road, Ntinda, Kampala | US$399per participant | |
2027 May BatchRegistration Open May 24 – 26, 2027 Monday to Wednesday | In-Person · Eureka Place Hotel & SuitesPlot 16 Vubyabirenge Road, Ntinda, Kampala | US$399per participant | |
2027 Jun BatchRegistration Open June 28 – 30, 2027 Monday to Wednesday | In-Person · Eureka Place Hotel & SuitesPlot 16 Vubyabirenge Road, Ntinda, Kampala | US$399per participant | |
2027 Jul BatchRegistration Open July 26 – 28, 2027 Monday to Wednesday | In-Person · Eureka Place Hotel & SuitesPlot 16 Vubyabirenge Road, Ntinda, Kampala | US$399per participant | |
2027 Aug BatchRegistration Open August 23 – 25, 2027 Monday to Wednesday | In-Person · Eureka Place Hotel & SuitesPlot 16 Vubyabirenge Road, Ntinda, Kampala | US$399per participant | |
2027 Sep BatchRegistration Open September 27 – 29, 2027 Monday to Wednesday | In-Person · Eureka Place Hotel & SuitesPlot 16 Vubyabirenge Road, Ntinda, Kampala | US$399per participant | |
2027 Oct BatchRegistration Open October 25 – 27, 2027 Monday to Wednesday | In-Person · Eureka Place Hotel & SuitesPlot 16 Vubyabirenge Road, Ntinda, Kampala | US$399per participant | |
2027 Nov BatchRegistration Open November 22 – 24, 2027 Monday to Wednesday | In-Person · Eureka Place Hotel & SuitesPlot 16 Vubyabirenge Road, Ntinda, Kampala | US$399per participant | |
2027 Dec BatchRegistration Open December 27 – 29, 2027 Monday to Wednesday | In-Person · Eureka Place Hotel & SuitesPlot 16 Vubyabirenge Road, Ntinda, Kampala | US$399per participant |
Published dates and registration status are subject to operational changes and seat availability. Confirm your selected batch before making travel or payment commitments.
Microsoft Power BI Course Learning Outcomes
By the end of a well-designed three-day programme, participants should be able to work through the principal Power BI analyst workflow with much greater confidence. The exact depth achieved depends on participants' baseline skills and the complexity of the practice data.
- Explain the roles of Power BI Desktop, the Power BI service, semantic models, reports, dashboards and workspaces.
- Connect to common business data sources and evaluate whether the source data is suitable for analysis.
- Use Power Query to clean, reshape, combine and load data through repeatable transformation steps.
- Choose appropriate data types and identify null values, duplicates, inconsistencies and other data-quality problems.
- Build table relationships and understand the practical value of star-schema design.
- Distinguish between fact tables, dimension tables, measures and calculated columns.
- Create DAX measures for totals, ratios, percentages, comparisons and time-based analysis at an appropriate introductory/intermediate level.
- Choose visuals according to the analytical question rather than decorating reports with unnecessary charts.
- Use slicers, filters, drill-through, tooltips and interactions to improve report exploration.
- Apply practical report-design principles for clarity, accessibility and business storytelling.
- Publish reports to the Power BI service and understand workspaces, sharing and app distribution at a practical level.
- Understand how row-level security can restrict data for different viewers.
- Explain the main considerations behind data refresh and on-premises gateway connections.
- Recognize where Copilot and AI-assisted capabilities may support analysis, subject to tenant and capacity requirements.
- Build an end-to-end practice report from raw data to a publishable analytical output.
Core Microsoft Power BI Training Modules
The programme follows the same broad skill areas Microsoft currently emphasizes for the Power BI Data Analyst role: preparing data, modeling data, visualizing and analyzing data, and managing and securing Power BI. The modules below translate those skill areas into a practical classroom workflow.
Power Query
Clean, transform and combine business data repeatably.
Tap, hover or focus to explorePower Query
Connect to files and other sources, profile data, correct data types, handle missing or inconsistent values, split and merge columns, append or merge queries, pivot or unpivot data and load a cleaner analytical structure.
Data Modeling
Design relationships that support accurate analysis.
Tap, hover or focus to exploreData Modeling
Identify facts and dimensions, create relationships, understand cardinality and filter direction, build a date dimension and use star-schema principles to make the semantic model clearer and more reliable.
DAX
Create measures that express business logic.
Tap, hover or focus to exploreDAX
Learn measure syntax, aggregation, filter context, calculated columns versus measures, CALCULATE-style reasoning, ratios, variance, percentages and introductory time-intelligence concepts through practical business examples.
Reports & Visuals
Turn the model into clear interactive analysis.
Tap, hover or focus to exploreReports & Visuals
Choose suitable visuals, format reports, use filters and slicers, configure interactions, drill through to detail, improve navigation and design pages that help users answer questions rather than simply display data.
Publish & Collaborate
Move reports from Desktop into managed sharing.
Tap, hover or focus to explorePublish & Collaborate
Understand the Power BI service, workspaces, roles, apps, report sharing, permissions, semantic-model access and the practical difference between authoring content and distributing it to consumers.
Security & Governance
Control who sees which reports and which data.
Tap, hover or focus to exploreSecurity & Governance
Learn workspace roles, semantic-model permissions, row-level security concepts, testing roles, appropriate sharing and why hiding a visual or column is not the same as enforcing data security.
Power BI Desktop, Power BI Service and Microsoft Fabric
Power BI training becomes easier when participants understand where different tasks happen. Power BI Desktop is the Windows authoring application used heavily for data connection, Power Query transformations, modeling, DAX and report design. The Power BI service is the online environment used to publish, organize, share and consume analytical content. Microsoft Fabric is a broader end-to-end analytics platform in which Power BI is one of the core workloads.
Power BI Desktop
Best suited to building and editing semantic models and reports. Participants use Desktop to connect to data, transform it in Power Query, create relationships and calculations, build report pages and test the model before publication.
Power BI Service
Best suited to publishing, collaboration, distribution and consumption. The service introduces workspaces, apps, permissions, scheduled refresh, dashboards, subscriptions and other organizational capabilities.
A professional analyst needs to understand the flow between these environments. Creating a report on a laptop is only one part of the work. The analyst also needs to know how the content will reach users, what permissions users require, how data stays current and how the organization avoids uncontrolled copies of different reports with conflicting logic.
Power Query: Cleaning and Preparing Data for Power BI
Power Query is the transformation layer used to connect to sources and prepare data before it becomes part of the semantic model. This is one of the most important areas for learners because real organizational data is rarely ready for analysis when it first arrives. Column names may be inconsistent, dates may be stored as text, blank records may appear, several files may need to be combined, categories may use different spellings or a wide spreadsheet may need to be reshaped into a structure that works better for analysis.
Participants learn to think in repeatable steps. Instead of manually deleting rows and changing cells every month, Power Query records transformation steps that can be reapplied when the source is refreshed. This encourages a more reliable reporting process, provided the source structure remains suitable for the transformations.
- Connect to Excel workbooks, CSV files and other suitable practice sources.
- Inspect column quality, distributions, data types and unexpected values.
- Rename and remove columns intentionally rather than carrying unnecessary data into the model.
- Replace errors or inconsistent values only after understanding what they represent.
- Split, merge and transform columns for cleaner analysis.
- Group and aggregate rows when the analytical grain requires it.
- Append similar tables and merge related queries where appropriate.
- Pivot and unpivot data to convert reporting-oriented spreadsheets into analysis-oriented structures.
- Use parameters and source settings appropriately in selected scenarios.
- Understand that transformations should be validated, not assumed to be correct because they run without an error.
Power Query versus manual spreadsheet cleanup
Manual cleanup changes the current file. Power Query creates a documented transformation process that can often be repeated when new data is supplied. That distinction is central to building sustainable reporting workflows.
Data Modeling, Relationships and Star Schema in Power BI
A report can look correct while being built on a weak data model. Modeling determines how tables relate and therefore how filters and calculations behave. Microsoft guidance emphasizes star-schema design because it provides a practical structure for semantic models: dimension tables describe entities such as dates, products, branches or customers, while fact tables record events or observations such as sales, payments, attendance or service transactions.
Participants learn the idea of analytical grain: what one row represents in each table. If one fact table contains one row per invoice and another contains one row per invoice line, combining fields carelessly can create incorrect totals. Understanding the grain and keys before creating relationships helps prevent many common reporting errors.
Relationships and cardinality
The course introduces one-to-many relationships as the common pattern between a dimension and a fact table, then explains why many-to-many relationships and bidirectional filtering require more careful judgment. Learners see how an incorrect relationship can produce blanks, duplicate totals or unexpected filtering.
Date tables and time analysis
Many business questions are time-based: month-to-date performance, year-on-year comparison, quarterly results or trend analysis. A dedicated date dimension creates a consistent basis for filtering and calculations across reports. Participants learn why relying on scattered transaction dates can become difficult once analysis grows beyond simple charts.
Model before decorating
Formatting cannot compensate for a model that double-counts transactions or mixes incompatible levels of detail. The course encourages participants to validate totals and relationships before spending significant time on visual design.
DAX Measures and Calculations in Power BI
Data Analysis Expressions, usually called DAX, is the formula language used to define calculations in Power BI semantic models. Microsoft describes DAX as a collection of functions, operators and constants that can be used in formulas to calculate and return values. Learners often arrive from Excel and recognise some familiar function names, but DAX introduces a different way of thinking because measures respond to filter context created by report selections, rows, columns and slicers.
The course begins with measures that aggregate data, then develops the difference between a raw column and a business measure. For example, total revenue should normally be defined once in the model and reused across visuals rather than recreated separately in several charts. Reusable measures improve consistency and make future changes easier to manage.
Core Measures
SUM, COUNT, DISTINCTCOUNT and related aggregations provide a foundation for reusable indicators such as revenue, transactions, beneficiaries or units.
Ratios & Percentages
Measures can express margin percentage, completion rate, utilization, conversion, variance percentage and other business ratios using explicit numerator and denominator logic.
Filter Context
The same measure can return different results depending on branch, month, product, customer or other filters applied by a visual or user selection.
CALCULATE Thinking
Participants learn the conceptual role of changing filter context to answer questions such as sales for a selected category or performance under specified conditions.
Time Comparison
With an appropriate date model, measures can support period comparisons and trend analysis rather than merely reporting current totals.
Measures vs Calculated Columns
Learners examine when a value should be calculated during model processing and when it should respond dynamically to report context.
DAX can become highly advanced. A three-day practical course should therefore build a sound foundation instead of rushing through dozens of functions without understanding context. Participants leave with a framework for reading, writing and testing measures and with clear directions for deeper practice after the course.
Power BI Reports, Visualizations and Data Storytelling
Visualizations are the visible layer of a Power BI report, but visual design should start with the analytical question. Microsoft describes visuals as the building blocks of Power BI reports and notes that they can interact through cross-filtering and cross-highlighting. The course therefore teaches participants to choose a visual based on what the user needs to compare, track, explain or investigate.
A column chart may be useful for comparing categories, a line chart for showing change over time, a card for a single headline measure, a table or matrix for detailed values, and a map only when location contributes meaningful analytical value. The presence of a visual type in Power BI does not mean it belongs on every report.
Designing report pages
Participants practise page hierarchy, alignment, spacing, titles, colour restraint, readable labels and deliberate use of whitespace. They also learn to avoid common dashboard problems such as too many visuals, excessive colour, tiny text, decorative charts with no decision value and inconsistent number formats.
Interactivity
Slicers, filters, drill-through, tooltips, bookmarks and visual interactions can turn a static report into an exploratory analytical experience. However, interactivity needs to remain understandable. A report becomes frustrating when users cannot predict why a number changed or how to return to the original view.
Good reports reduce cognitive effort
The objective is not to demonstrate every Power BI feature. It is to help the intended user see what matters, understand the context and explore detail without losing confidence in the numbers.
Publishing, Workspaces and Collaboration in the Power BI Service
Once a report is ready in Desktop, it can be published to the Power BI service. This introduces organisational questions that do not exist in a personal `.pbix` file: which workspace should contain the content, who can edit it, who should only view it, which semantic model powers the report and how should a wider audience receive the finished content?
Microsoft workspaces provide roles such as Admin, Member, Contributor and Viewer. Those roles affect what a person can do in a workspace. Training therefore needs to distinguish collaboration with report creators from distribution to report consumers. Giving every viewer contributor-level access is not a substitute for designing appropriate permissions.
The course also explains that sharing a report can imply access to its underlying semantic model. Security needs to be designed deliberately. Hiding a page, visual, table or field from the report interface is not itself a security control.
Authoring & Collaboration
Use workspaces to organise content and collaborate with the people who develop, manage and maintain reports, semantic models and related assets.
Distribution & Consumption
Use appropriate sharing or app-distribution patterns so users can consume the reports they need without unnecessarily receiving editing privileges.
Power BI Security and Row-Level Security
Security is particularly important when a report contains financial, HR, customer, programme or other restricted information. Power BI provides several layers of permissions, and row-level security (RLS) can restrict which rows of a semantic model particular users can see. Microsoft also documents object-level security for restricting access to specific model objects in appropriate scenarios.
Participants learn the conceptual workflow for RLS: define roles and filter rules, publish the model, assign users or groups and test the experience as the intended role. The course emphasizes that RLS is a data-security feature, not simply a visual filter. It is designed to restrict rows at the model level for applicable users.
- Distinguish workspace roles from row-level data access.
- Understand static and dynamic security concepts at an introductory level.
- Create and test a simple RLS role in a practice model.
- Recognise that hiding report elements does not secure the underlying data.
- Apply least-privilege thinking when deciding who needs edit, build or view access.
- Understand that enterprise security design should follow organisational governance and Microsoft licensing/capacity rules.
Data Refresh and On-Premises Gateway Management
A dashboard is valuable only if users understand how current its data is. Power BI refresh behaviour depends on the source, storage mode and service configuration. Imported data normally needs to be refreshed from the source, while DirectQuery scenarios behave differently because report interactions query the underlying source.
If the Power BI service cannot reach an on-premises data source directly, a gateway connection may be required before scheduled refresh can succeed. Microsoft generally recommends the standard enterprise gateway for organisational scenarios rather than relying on a personal gateway for shared production use.
What participants need to understand
- The difference between refreshing visuals, refreshing imported data and changes to source schema.
- How credentials and data-source settings affect refresh.
- Why a report can be beautifully designed but still fail operationally when a source is unavailable.
- The role of the on-premises data gateway for suitable local data sources.
- How to inspect refresh history and failure notifications rather than discovering stale data through a user complaint.
- Why production refresh schedules and capacity limits should be validated against the organisation's actual Power BI environment.
Copilot and AI-Assisted Analytics in Power BI
Microsoft continues to integrate Copilot capabilities into Power BI and Fabric. Current Power BI Copilot experiences can assist with tasks ranging from analysis to DAX generation and report creation, but access depends on organizational configuration, supported capacity and tenant settings. The course therefore presents Copilot as an assisted analytical capability rather than a replacement for modeling, validation or business judgement.
Participants should understand a simple principle: AI can help generate or explain an output, but the analyst remains responsible for whether the data model is appropriate and whether the result is correct. A generated DAX measure can be syntactically valid and still answer the wrong business question. The ability to validate assumptions becomes more important, not less important, as AI makes content faster to generate.
Microsoft has also announced that the older Power BI Q&A experiences are being retired in December 2026 in favor of newer Copilot-oriented natural-language experiences. Training therefore avoids over-investing in features that are being deprecated and instead teaches durable modeling, report-design and analytical principles.
AI readiness starts with model quality
Clear names, well-designed relationships, meaningful measures and understandable business definitions make analytical models easier for both people and AI-assisted tools to interpret.
Alignment With Microsoft PL-300 Power BI Data Analyst Skills
Microsoft's current PL-300 study guide groups the Power BI Data Analyst role into four broad skill areas: prepare the data, model the data, visualize and analyze the data, and manage and secure Power BI. The April 2026 skills outline assigns approximately 25–30% to each of the first three areas and 15–20% to managing and securing Power BI.
This course is designed to develop practical competence across those same professional skill areas, but it should not be described as an official Microsoft certification course unless the provider has the appropriate Microsoft status and the programme is explicitly structured that way. Participants who plan to sit PL-300 can use Microsoft Learn's official study guide and learning paths for exam-specific preparation after the workshop.
| PL-300 Skill Area | How This Course Supports It |
|---|---|
| Prepare the data | Connecting to sources, profiling, cleaning, transforming, combining and loading data with Power Query. |
| Model the data | Relationships, semantic-model structure, date tables, star-schema thinking and DAX measures. |
| Visualize and analyze | Visual selection, filters, slicers, drill-through, report interactions, formatting, analysis and storytelling. |
| Manage and secure Power BI | Publishing, workspaces, permissions, sharing, refresh concepts, row-level security and governance awareness. |
Power BI Applications Across Ugandan Sectors
Practical training becomes more useful when participants can connect the technical skill to a reporting problem they recognise. The examples below illustrate how the same analytical platform can support different functions. They are examples, not claims that every organisation should build exactly the same dashboards.
Finance & Banking
Budget-versus-actual reporting, branch performance, portfolio analysis, revenue trends, cost analysis, transaction summaries and management KPIs.
NGOs & Development
Project indicators, beneficiary reach, geographic analysis, activity tracking, donor reporting, survey summaries and programme-performance dashboards.
Retail & Distribution
Sales by branch or product, inventory movement, margins, customer patterns, stock performance and sales-team analysis.
Human Resources
Headcount, turnover, recruitment, attendance, learning, performance and workforce-demographic analysis using appropriately governed HR data.
Public Sector
Service-delivery indicators, administrative performance, programme monitoring, regional comparisons and management reporting from approved datasets.
Healthcare & Education
Operational trends, service volumes, enrolment, attendance, resource use, quality indicators and management summaries subject to privacy requirements.
The best classroom examples use de-identified or synthetic data unless the organisation has deliberately approved the use of internal data. Participants should not upload confidential information into practice environments simply to make an exercise feel realistic.
Power BI Training Format and Methodology
Power BI is best learned by building. Demonstration is useful, but participants need time to repeat the steps themselves, make mistakes, inspect results and understand why the model behaves as it does. The three-day programme therefore follows an instructor-guided lab approach rather than a presentation-heavy seminar.
Day 1: data preparation and model foundations
Participants begin with the Power BI environment, connect to practice data and work through Power Query transformations. They then build a basic model, create relationships and validate the data structure. The goal is to establish a reliable foundation before moving into sophisticated visuals.
Day 2: DAX and interactive report development
The second day focuses on measures, business calculations, filter context, report pages, visual selection, slicers, drill-through and design. Participants work with a dataset long enough to experience how a model, calculation and visual interact.
Day 3: service, sharing, security and end-to-end project
The final day introduces publishing, workspaces, refresh, security and appropriate AI-assisted capabilities. Participants consolidate the learning in an end-to-end exercise that requires them to prepare data, build the model, create measures and communicate insights in a coherent report.
Recommended participant setup
Each participant should ideally have a Windows laptop capable of running the current Power BI Desktop application, permission to install or use the software, and enough familiarity with spreadsheets to work comfortably with tables and formulas. Access to the Power BI service depends on the participant's or organisation's Microsoft account and licensing environment.
How to Choose Microsoft Power BI Training in Uganda
A good Power BI course should not be selected only by the number of features listed in the brochure. The important question is whether participants will leave able to build and validate useful analysis independently. Ask how much of the programme is hands-on, whether the trainer teaches data preparation and modeling before report decoration, and whether participants work through an end-to-end dataset rather than watching disconnected demonstrations.
Questions to ask before booking
- Does the course teach Power Query, modeling and DAX as well as visualization?
- Will every participant build reports during the sessions?
- Does the curriculum reflect current Power BI and Microsoft Fabric terminology?
- How are Power BI service, workspaces, sharing and security handled?
- Will participants receive practice files or exercises for continued learning?
- Can examples be adapted to finance, M&E, HR, sales, operations or another relevant function?
- Are certification claims clearly distinguished from independent professional training?
- Does the trainer explain why a model is designed a certain way rather than teaching only button sequences?
Robert Mwesige can facilitate Power BI training for organisations and individual professionals in Uganda using a practical, guided workshop format. Corporate programmes can be adapted around the organization's reporting challenges and participant baseline while still protecting confidential data and maintaining a coherent skills progression.
Frequently Asked Questions About Microsoft Power BI Training in Uganda
What is covered in a Power BI training course?
A comprehensive beginner-to-intermediate course normally covers Power BI Desktop, connecting to data, Power Query, data cleaning, table relationships, semantic-model design, DAX measures, visualizations, filters, report design, publishing to the Power BI service, workspaces, sharing, refresh concepts and introductory security such as row-level security.
Do I need advanced Excel skills before learning Power BI?
No. Strong Excel experience is helpful because learners are already comfortable with tables and formulas, but it is not a strict prerequisite for understanding Power BI. Participants should be able to work confidently with basic spreadsheets and business data.
Is Power BI Desktop free?
Microsoft currently provides Power BI Desktop as a free Windows application. Publishing, collaboration and sharing in the Power BI service can require appropriate licensing or capacity depending on the organisation's scenario, so participants should check their own Microsoft environment.
Can the course prepare me for PL-300?
The practical skills overlap strongly with the current PL-300 Power BI Data Analyst domains: data preparation, modeling, visualization and analysis, plus management and security. However, this independent workshop is not presented as an official Microsoft certification course. Candidates should use the official Microsoft Learn study guide for exam-specific preparation.
What is DAX in Power BI?
DAX stands for Data Analysis Expressions. It is the formula language used to create calculations in Power BI semantic models. Measures can calculate totals, ratios, percentages, variances and context-sensitive business metrics used across reports.
What is Power Query used for?
Power Query is used to connect to, clean, transform and combine data before it is loaded into the Power BI model. It is particularly valuable because transformation steps can be repeated when source data is refreshed.
Can Power BI connect to Excel data?
Yes. Excel is a common source for Power BI, and the course uses spreadsheet-style datasets to demonstrate connection, transformation and modeling. Power BI can also connect to databases, cloud services, files and many other supported sources.
Can organisations request in-house Power BI training?
Yes. Corporate training can be adapted to participant roles, baseline skill level and reporting priorities. Internal examples should use approved, de-identified or otherwise suitable data so the training does not expose sensitive information.
How long is the Kampala Power BI course?
The published open-enrolment programme is structured as a three-day classroom course. Organisations can request shorter introductory sessions or deeper customised programmes depending on the required outcomes.
Does Power BI support AI and Copilot?
Yes. Microsoft currently provides Copilot experiences for Power BI and Fabric, but availability depends on tenant settings and supported paid capacity. The course explains the role of AI-assisted analytics while emphasising that generated measures and insights still need human validation.
Authoritative Microsoft Power BI References
The following Microsoft Learn resources support the technical terminology and curriculum used in this guide. They are included as genuine further-reading destinations rather than decorative citations.
What Is Power BI?
Official overview of Power BI, Power BI Desktop, the Power BI service and Power BI within Microsoft Fabric.
Read Microsoft's Power BI overview →Get Started With Power BI Desktop
Official introduction to connecting data, shaping it and creating interactive reports in Power BI Desktop.
Start with Power BI Desktop →Model Data With Power BI
Microsoft learning path covering semantic models, relationships and DAX-based calculations.
Explore the modeling learning path →Understand Star Schema
Microsoft guidance on star-schema design and its importance for Power BI semantic models.
Read the star-schema guidance →Learn DAX Basics
Official introduction to DAX syntax, functions and context for Power BI Desktop calculations.
Learn DAX basics →PL-300 Power BI Data Analyst Study Guide
Current official skills outline covering data preparation, modeling, visualization and analysis, plus management and security.
View the PL-300 study guide →Share and Collaborate in Power BI
Official guidance on sharing reports, dashboards, semantic models, workspaces, apps and permissions.
Read sharing guidance →Data Refresh in Power BI
Microsoft guidance on refresh types, data-source dependencies, gateways, schedules and failure monitoring.
Read refresh guidance →Need Microsoft Power BI Training in Uganda?
Book an upcoming Kampala batch or discuss a customised in-house programme for your finance, M&E, HR, sales, operations, research or management team.